What does gentrification in Philadelphia look like?
“High-rise, modern apartment buildings.”
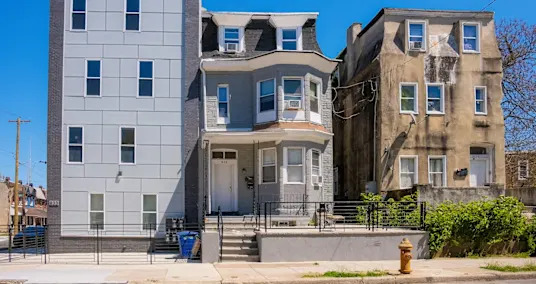
“(A) modern look that’s so out of place with our traditional row homes that have been here for a hundred years.”
“Six- to seven-floor high-rises with garages in the basement. They charge an extra $200 to park.”
“Gray, industrial looking.”
“The houses are ugly as heck. No architectural style. They’re probably two-bedroom, some probably one. And they usually put a deck up. It’s not geared for kids or families. A lot of steps.”
These are some of the descriptions that longtime residents of gentrifying neighborhoods in Philly used to describe the new construction popping up around them.
We are Ph.D. candidates in architectural engineering and geography, environment and urban studies at Drexel and Temple universities in Philadelphia. Working with a multidisciplinary team of professors and students, we recently developed a new way to map gentrification in Philly neighborhoods using a combination of accounts from longtime residents, Google Street View images and machine learning.

Using AI to spot gentrification
Our team posited that the best source for knowing what gentrification looks like comes from the perceptions of longtime residents in gentrifying neighborhoods.
So we held focus groups in three rapidly gentrifying neighborhoods – one in Northeast Philadelphia and two in the River Wards section north of Center City and along the Delaware River.
We asked residents to identify the visual cues of building designs, materials, colors and landscaping choices that they associate with gentrification.
Many of these residents could recount, in great detail, the exact street intersections where they saw gentrification-related development occur over the decades.
We corroborated each location they identified through historical Google Street View imagery. By examining the exteriors of these buildings, we could expand upon the more generalized language used in the discussions, such as “modern” or “boxy,” to , such as “presence of bump-out windows” and “increased floor area ratio,” which is a measure of how much of the surface area of a land parcel a building takes up.
When pulling panoramas of residential building exteriors from Google Street View, we looked at two distinct time periods: 2009-13 and 2017-21.
AI is getting better at spotting the visual signs of gentrification. Researchers refer to AI systems that categorize scenery according to certain characteristics, like seeming “gentrified” or “not-gentrified,” as “deep mapping” models.
Deep mapping models use neural network algorithms, which can pick up on patterns in big datasets. The particular model we used is able to pick up subtle, pixel‑level differences between two images.
The model learned to approximate how residents distinguish gentrified scenes from unchanged ones. When we tested the model’s output, we found that it was able to separate “gentrified” from “not‑gentrified” images with an accuracy of about 84%. This showed us that visual cues guided by residents’ observations can be translated into a reliable machine learning signal.
Gentrification doesn’t always look the same
As a neighborhood becomes gentrified, wealthier people move in and long-standing residents can be displaced through rent hikes or the loss of housing. Gentrification can also lead to the disappearance of a “sense of place” – characteristics that make a neighborhood feel familiar and like home.

With deep mapping models, researchers and neighborhood stakeholders can pull their own data on landscape changes related to gentrification and better understand how gentrification changes physical environments. With better data, they can map hot spots of new development and use machine learning models that predict future trajectories of change.
For example, several of our focus group participants in one neighborhood noted that gentrification was connected to the demolition of old buildings that likely contained hazardous substances, such as asbestos and lead. They wondered about the potential for air pollution. With accurate data on where development is occurring, researchers can model relationships between new construction and environmental conditions such as air quality.
Moreover, this process can also give legitimacy to neighborhood groups that may see changes occurring around them but lack the quantitative data to legitimatize their concerns to the media and to city government.
By being more explicit about how gentrification is defined when we categorize images and train our machine learning model, researchers can be more transparent about how image data is prepared and prevent personal biases from guiding the model and the patterns it learns.
For example, certain research finds that gentrification leads to increased greenery. However, some participants in our focus groups reported that gentrification resulted in the loss of community gardens and greenery. This experience runs contrary to common assumptions in gentrification research.
Transparency in training models builds trust
By defining how gentrification is perceived by residents, researchers like us can add clarity to how we prepare the model data. Even with more clarity, however, these AI systems are still “black box” in nature. A black box model means that the connection between inputs and outputs is unclear to the model user.
One way to make the model more transparent is by applying an additional model called XAI, or explainable artificial intelligence. Through XAI, there is potential to better understand which characteristics in an image are more important to the model prediction. For example, does the model focus on the windows of a building or the relative height of buildings?
Answering these questions will help researchers and stakeholders trust model predictions.
At the same time, one of us is leading a complementary line of research focused on explaining the reasoning behind the machine learning model decisions. In Philadelphia and many other U.S. cities, street scenes can have a dense mix of cars, vegetation and architectural styles that can confuse the model. There is a lot of complicated visual information to parse through, a lot of variety. Understanding the model’s internal logic helps ensure that its predictions reflect real neighborhood dynamics rather than irrelevant details in the imagery.
Together, these research directions aim to deepen our understanding of how gentrification unfolds on the ground and how AI can help illuminate patterns that might otherwise go unnoticed.
Read more of our stories about Philadelphia and Pennsylvania, or sign up for our Philadelphia newsletter on Substack.
This article is republished from The Conversation, a nonprofit, independent news organization bringing you facts and trustworthy analysis to help you make sense of our complex world. It was written by: Maya Mueller, Drexel University and Isaac Quaye, Temple University
Read more:
Maya Mueller receives funding from the National Science Foundation.
Isaac Quaye received funding from the National Science foundation.
LATEST POSTS
- 1
 Solid Living Tips: Experiences from a Wellness Fan
 - 2Kansas school officials report high student illness, dismiss early
- 3New ‘Cloud-9’ object could reveal the secrets of dark matter
- 4Effectiveness Uncovered: A Survey of \Smoothing out Your Errands\ Efficiency Application
- 5PHOTO ESSAY: Scientists trying to unravel one of the body's biggest mysteries


- Instructions to Arrange Your Compensation During Medical caretaker Prospective employee meetings
- The last penny was pressed by the U.S. Mint in Philadelphia today. Could the nickel and dime be next?
- What happened in 'Wicked' part 1 and will there be a 3rd movie? Recap and what Ariana Grande, Jon M. Chu have said about a sequel.
- West Antarctica’s history of rapid melting foretells sudden shifts in continent’s ‘catastrophic’ geology
- Famous SUVs With Low Energy Utilization In 2024
- A Lone Wolf Outsmarted Hunters in the Black Forest and Then Vanished
- Popular Film Areas: A Worldwide Manual for Film Enchantment
- Italy's Beloved Trevi Fountain Hides A Unique Secret That Can Be Explored Underground
- 23 Most Amusing Messages At any point Sent Among Kids and Their Folks